Most AI agent failures are not mysterious once you can see the run.
The problem is that many teams still ship agents with the same visibility they used for a chatbot prototype: a request log, a final answer, and maybe a token count.
That is not enough in production.
An agent does not just answer. It plans, calls tools, reads retrieved context, asks for approvals, retries after errors, hands off to other agents, and sometimes touches systems that have real side effects. If you cannot reconstruct that path after a bad result, you do not have observability. You have vibes with timestamps.
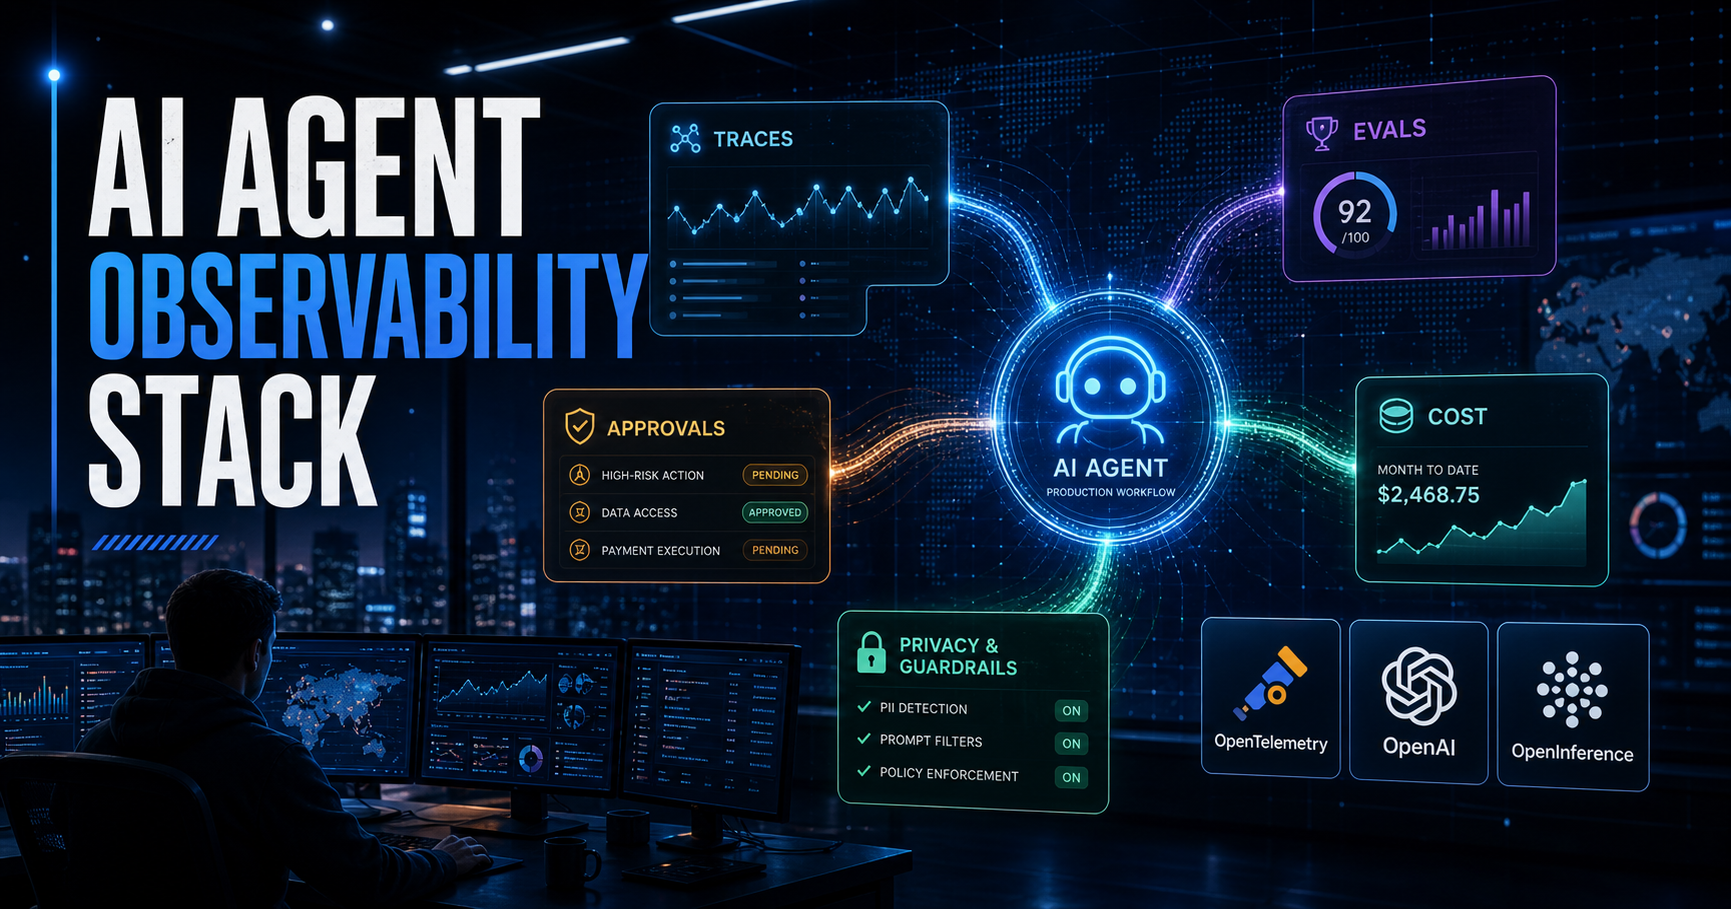
This guide is a practical setup path for a production-friendly AI agent observability stack in 2026: traces, spans, evals, approval logs, cost metrics, and privacy controls.
TL;DR
For production agents, track five layers:
- Trace the run so you can replay the agent’s path from user request to final output.
- Log tool calls with inputs, outputs, latency, status, and side-effect level.
- Record approvals for anything that writes, sends, spends, deletes, deploys, or changes account state.
- Run evals against real failure modes, not just generic answer quality.
- Measure cost and reliability per workflow, model, tool, tenant, and release.
The mistake is treating observability as a dashboard you add later. For agents, observability is part of the safety boundary.
Who this is for
This setup is for teams building agents that do more than chat:
- internal copilots with access to documents, tickets, repos, CRM, or cloud APIs
- coding or operations agents that call tools and modify files
- support agents that draft refunds, emails, or account changes
- research agents that retrieve sources and produce reports
- workflow agents that pause for human approval before sensitive actions
If your system is still a single prompt that returns text, you can start smaller. But if the agent can call tools, you need this shape before the first real production rollout.
The stack: what you need to capture
The clean mental model is:
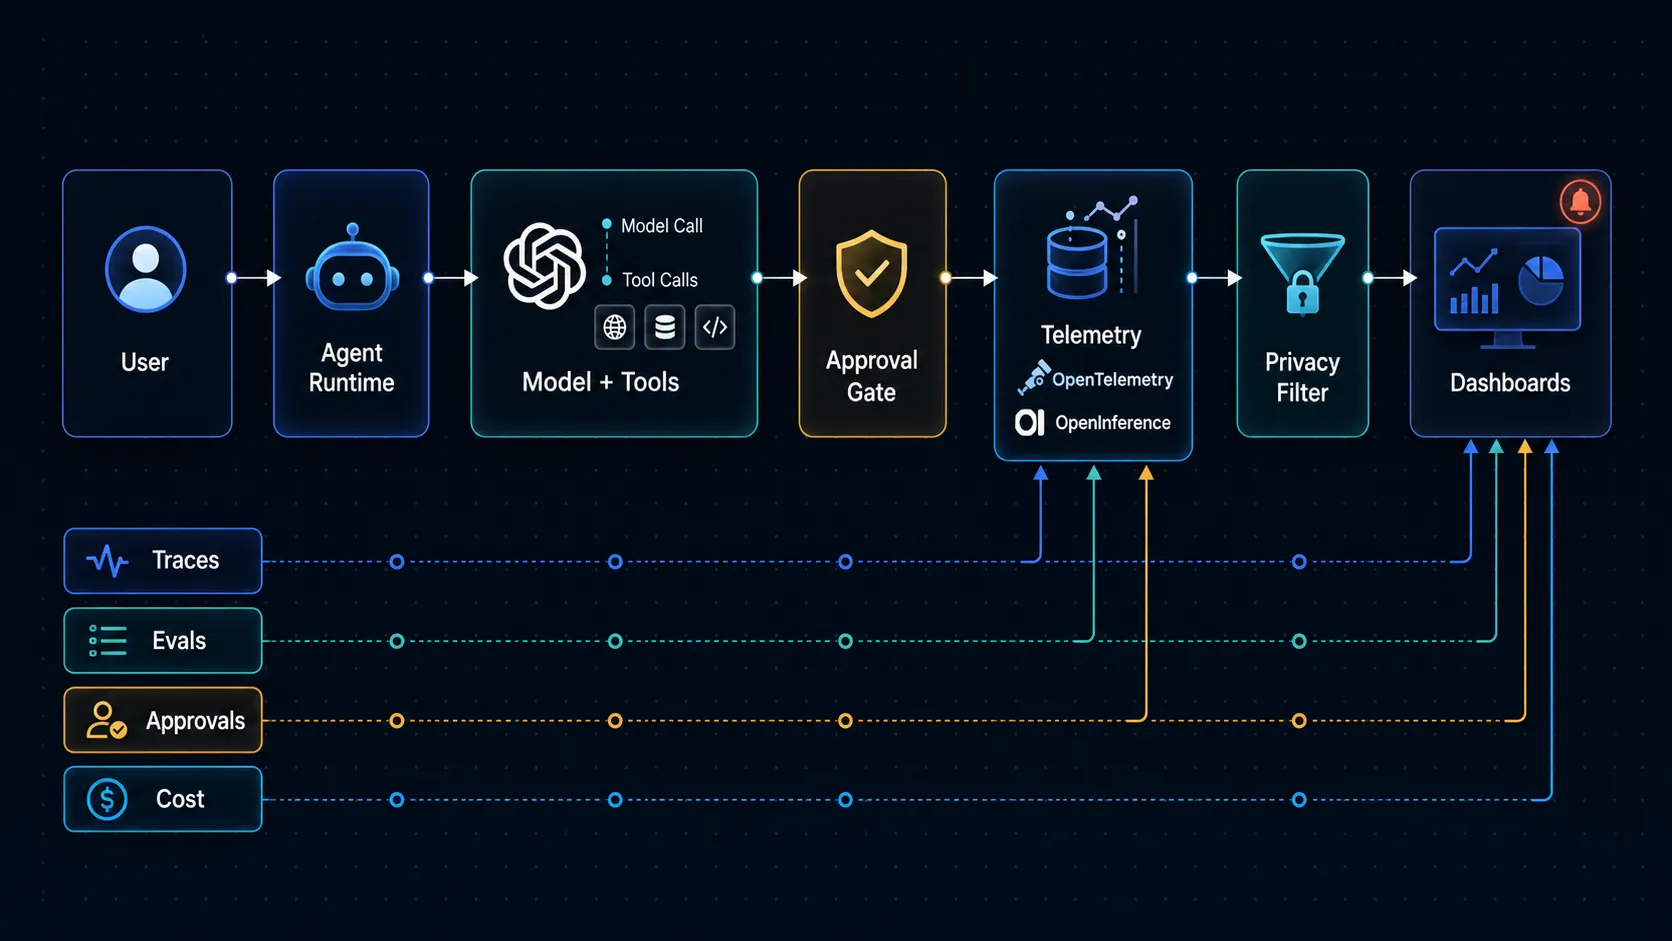
1. Traces: the end-to-end story
A trace should represent one meaningful agent workflow.
For example:
- “answer this support ticket”
- “research this company”
- “prepare a pull request”
- “summarize this contract”
- “update this internal record after approval”
The OpenAI Agents SDK includes built-in tracing for agent runs, model generations, tool calls, handoffs, guardrails, and custom events. OpenTelemetry’s GenAI semantic conventions define AI-specific signals for model operations, agent spans, events, exceptions, and metrics. OpenInference also builds on OpenTelemetry to describe LLM calls, agent steps, tool invocations, retrieval operations, and token/cost fields in a trace-friendly way.
The practical point is simple: do not reduce an agent run to one log line.
You want a tree.
agent_run
  -> user_request
  -> retrieval_query
  -> model_generation
  -> tool_call
  -> approval_request
  -> tool_execution
  -> final_response
That tree gives you the first thing every production team needs after an incident: a timeline.
2. Spans: the operations inside the run
Each important step should become a span or event:
- LLM generation
- retrieval query
- tool call
- guardrail check
- handoff
- approval request
- approval decision
- retry
- fallback model route
- final response assembly
For each span, capture:
| Field | Why it matters |
|---|---|
workflow_name | Groups traces by product feature or agent type. |
trace_id | Lets support, engineering, and security talk about the same run. |
span_type | Distinguishes model calls, tool calls, retrieval, approvals, and guardrails. |
model | Shows which model actually handled the step. |
tool_name | Shows which external system was touched. |
status | Separates success, error, rejection, timeout, and fallback. |
latency_ms | Finds slow model calls, slow tools, and stuck approvals. |
cost_usd or token fields | Prevents hidden agent loops from becoming budget leaks. |
release_version | Connects regressions to deployments. |
tenant_id or team key | Enables debugging without exposing raw user data. |
This is where OpenTelemetry-style thinking helps. You are not inventing a special “AI dashboard” from scratch. You are making agent work visible as distributed operations.
Approval logs are not optional
If an agent can perform a sensitive action, approval records are part of the audit trail.
The OpenAI Agents SDK human-in-the-loop flow pauses a run when a tool call requires approval, returns interruptions, and lets the run resume later from the same run state. That pattern is exactly what production teams should preserve in their own logs.
At minimum, an approval record should include:
trace_idtool_name- requested action
- risk level
- requester or agent identity
- reviewer identity
- decision: approved, rejected, edited, expired
- decision time
- reason or policy note
- resulting tool execution status
Do not only log the final tool result. Log the request, the decision, and the execution.
That is the difference between “the agent changed a customer record” and “the agent proposed a record change, Maria approved it at 10:42, and the write succeeded 800 ms later.”
A minimal event schema you can start with
Start with one shared event shape. You can refine later.
{
  "timestamp": "2026-05-13T09:30:00Z",
  "trace_id": "trace_agent_support_01",
  "workflow": "support_refund_assistant",
  "span_id": "span_tool_refund_01",
  "parent_span_id": "span_agent_plan_01",
  "event_type": "tool_call",
  "model": "reasoning-default",
  "tool_name": "refund.create_draft",
  "side_effect": "draft_only",
  "status": "ok",
  "latency_ms": 842,
  "input_redacted": true,
  "output_redacted": true,
  "tokens_in": 1240,
  "tokens_out": 310,
  "estimated_cost_usd": 0.018,
  "release": "agent-2026.05.13",
  "tenant_hash": "tenant_7f3a"
}
For approvals, keep the same trace and add an approval-specific event:
{
  "timestamp": "2026-05-13T09:31:11Z",
  "trace_id": "trace_agent_support_01",
  "event_type": "approval_decision",
  "tool_name": "refund.submit",
  "decision": "rejected",
  "reviewer_role": "support_lead",
  "reason": "Amount exceeded policy limit",
  "release": "agent-2026.05.13"
}
The important detail is not the exact field names. It is that every high-risk step can be joined back to the same trace.
Add evals where dashboards cannot help
Dashboards tell you what happened.
Evals tell you whether the behavior is good enough.
A production agent eval set should include:
- common happy-path tasks
- known failure cases
- prompt-injection attempts
- missing-context cases
- bad-tool-output cases
- approval-required actions
- cost and latency thresholds
- refusal or escalation behavior
For agent systems, a good eval is not just “did the final answer look nice?”
It should ask:
- Did the agent use the right tool?
- Did it avoid tools when it lacked permission?
- Did it ask for approval at the right moment?
- Did it cite or preserve source context?
- Did it stop instead of looping?
- Did it escalate when the risk was too high?
This pairs naturally with the testing pattern in Promptfoo: LLM Evals + Red-Teaming Workflow and the control model in AI Coding Agents Need Guardrails, Not More Autonomy.
Privacy: capture enough, not everything
Observability can become a data leak if you capture raw prompts, retrieved documents, tool outputs, and user identifiers without controls.
The OpenAI Agents SDK tracing docs note that generation spans and function spans may capture inputs and outputs, and expose configuration for sensitive data capture. OpenInference also treats privacy sensitivity as a first-class observability issue because prompts and completions can contain personal data.
The practical rule:
log the structure of the run by default, and make full payload capture a controlled debug mode.
Use these defaults:
- hash tenant and user identifiers
- redact emails, tokens, phone numbers, and account IDs before export
- store full prompts only for approved debug sessions
- separate trace metadata from sensitive payload storage
- set short retention for high-sensitivity traces
- block secrets from serialized run state
- never ship raw customer data to a vendor dashboard without policy approval
If a trace cannot be shared safely in an incident review, it is not production-ready telemetry.
Dashboard views that actually help
Start with four dashboards.
1. Workflow health
Show:
- success rate by workflow
- error rate by release
- p95 and p99 latency
- average tool calls per run
- retries per run
- fallback model usage
This is your “is the agent broken?” view.
2. Tool-risk view
Show:
- tool calls by tool name
- write/delete/send/spend actions
- approval rate
- rejection rate
- failed execution after approval
- top tools by incident count
This is your “what can the agent actually touch?” view.
3. Cost view
Show:
- cost per workflow
- cost per tenant or team
- tokens per run
- retry cost
- fallback cost
- top expensive traces
This catches invisible runaway loops before finance catches them for you.
4. Eval regression view
Show:
- pass rate by eval suite
- failures by release
- failures by model route
- approval-policy failures
- prompt-injection failures
- source-grounding failures
This is the view you check before rollout.
Implementation starter checklist
Use this sequence:
- Define your agent workflows by name.
- Assign a
trace_idto every run. - Instrument model calls, retrieval, tool calls, approvals, guardrails, and handoffs.
- Redact sensitive fields before export.
- Add approval records for every sensitive tool.
- Create eval suites for the top five failure modes.
- Add release/version tags to every trace.
- Build dashboards for workflow health, tool risk, cost, and eval regressions.
- Set alerts for approval bypass, high-cost loops, repeated tool failure, and eval regression.
- Review traces weekly with product, engineering, and security until the failure modes stabilize.
Do not try to build the perfect observability stack in one weekend. Start with trace shape, approval records, and one eval suite. Then deepen the stack where incidents and user feedback point.
What not to do
Avoid these mistakes:
- logging only the final answer
- capturing raw prompts forever
- treating approval as a UI event instead of an audit record
- hiding provider/model routes behind vague aliases with no trace metadata
- failing over to another model without marking it in the trace
- measuring cost only at the account level
- running evals only before launch, not after changes
- giving support teams no trace link when users report a bad answer
The quiet killer is not one dramatic model failure. It is hundreds of small opaque failures that nobody can explain.
FAQ
Do I need OpenTelemetry for a small agent?
Not necessarily on day one. But you should still design your events as if they could become traces later. If the agent will call tools or touch customer data, use a trace-style structure from the start.
Should I store full prompts and outputs?
Only when you have a clear privacy and retention policy. For normal production, store metadata and redacted payloads. Use full capture for controlled debugging.
Are evals the same as monitoring?
No. Monitoring tells you what happened in production. Evals test whether the agent behaves correctly against known tasks and failure modes. You need both.
What is the first metric to alert on?
Start with tool failure rate and approval anomalies. If a sensitive tool is suddenly failing, bypassing review, or getting rejected more often, you want to know quickly.
Bottom line
Production agents need more than a chat transcript.
They need traces that explain the workflow, tool logs that show external actions, approval records that preserve human decisions, evals that catch regressions, and cost controls that stop runaway behavior.
The goal is not to watch the agent for fun.
The goal is to make the system explainable enough that when something goes wrong, your team can answer three questions fast:
- What happened?
- Why did it happen?
- What should we change before the next run?
If your observability stack can answer those questions, the agent is much closer to being production-ready.