Most teams do not have an “LLM quality problem.”
They have an LLM visibility problem.
The moment an assistant can call tools, hit APIs, write code, or route user data, debugging stops being “read the chat transcript” and becomes the same thing it has always been in production systems:
- what happened?
- where did time go?
- why did cost spike?
- which input shape triggers failures?
- which tool call cascaded into the mess?
That is tracing.
This post is a practical path to tracing without committing to a single vendor forever: use OpenTelemetry as the common language, ship OTLP to a collector, and pick a backend (open source like Phoenix, or a vendor dashboard) based on your team’s reality.
If you want the complementary discipline for behavior, not just visibility, pair this with: Prompt Testing Is Becoming Mandatory: A Practical Promptfoo Evals Workflow.
The stack in one sentence
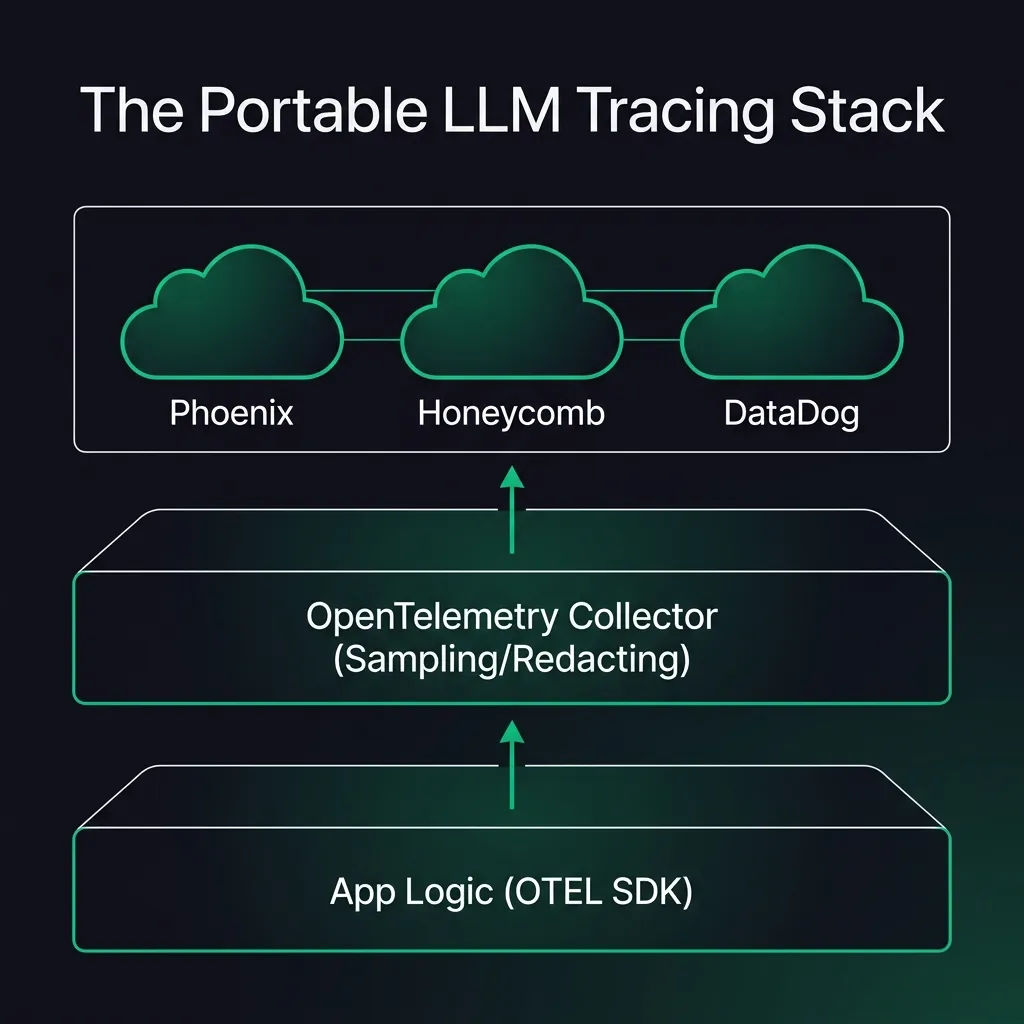
Instrument your app → emit OpenTelemetry spans using emerging GenAI conventions → export via OTLP → route through an OpenTelemetry Collector → visualize in the backend you prefer.
This is the “don’t regret it later” shape because it creates a clean seam:
- instrumentation stays in your code
- collection/routing stays in infra
- the UI/backend can change without rewriting everything
Why OpenTelemetry is the default escape hatch
OpenTelemetry is not “LLM observability.”
It is the boring interoperability layer for telemetry: traces, metrics, logs, and a standard export protocol (OTLP). That matters because LLM apps are now distributed systems:
- app server spans
- tool calls (HTTP, DB, queue)
- model calls (chat/completions, embeddings)
- retries, fallbacks, caches, gateways
If those layers cannot share a single trace, you will keep guessing.
OpenTelemetry is also actively defining GenAI semantic conventions (attributes, span names, event names). As of March 2026, that GenAI spec is explicitly marked Development and includes guidance for stability opt-ins, which is exactly the kind of warning you want to read before you bet your dashboards on it. Source: OpenTelemetry GenAI agent/framework semantic conventions.
If you want a second (complementary) vocabulary focused specifically on AI app spans, Arize’s OpenInference project is designed to pair with OpenTelemetry and is natively supported by Phoenix. Source: OpenInference overview.
What “good” tracing looks like for LLM apps
You do not need 200 attributes per span.
You need answers to a short list of operational questions:
1) Reliability: what failed, and where?
- model errors vs tool errors
- invalid structured outputs (JSON/tool args)
- “agent loop” runaway behavior (retries, tool spam)
2) Latency: what is the slowest hop?
- LLM time vs retrieval time vs tool time
- the one tool call that dominates the request
3) Cost: what is the cost driver?
- token usage per route / feature / customer tier
- “cheap model fallback” vs “expensive model escalation”
- unexpected prompt bloat (context inflation)
4) Security & safety: what should never be stored?
- secrets
- raw customer PII
- full tool outputs that contain sensitive data
Tracing is only helpful if it is safe enough to keep turned on.
Three common implementation patterns (and when each wins)
There is no one “best” tool. There is a best architecture boundary.
Here are the patterns you will see in real teams:
Pattern A: App-level OpenTelemetry, backend of choice (the default)
You instrument in the app using OpenTelemetry SDKs and/or LLM-specific wrappers, then export spans to any OTLP endpoint.
This is the safest long-term bet.
Open-source backends like Phoenix lean into that: “Phoenix uses OpenTelemetry (OTEL) for seamless setup… free from lock-in.” Source: Phoenix OSS overview.
Pattern B: Vendor dashboard, but still ingesting OpenTelemetry
Sometimes you want the “batteries included” workflow: datasets, prompt playgrounds, evaluation UI, collaboration.
The lock-in risk drops a lot if the vendor can ingest OpenTelemetry.
LangSmith, for example, publicly described adding OpenTelemetry trace ingestion (so you can point an OTEL exporter at their endpoint). Source: LangChain blog: OpenTelemetry support for LangSmith (Dec 9, 2024).
Pattern C: Proxy/gateway first (fast integration, but watch the boundary)
Gateways and proxies can be a one-line integration win because they sit in the traffic path (change a base URL, add a header, route requests).
Helicone positions itself as an open-source LLM observability platform and gateway, emphasizing “single line integration” and observability features. Source: Helicone GitHub org / repos.
Proxies are great for:
- fast adoption across many services
- centralized rate limiting / caching / routing
- consistent metadata injection
But they do not replace app-level traces. They usually see the model hop, not your internal tool graph.
A practical “week one” setup (minimal, but real)
The goal in week one is not perfection.
The goal is a single trace per user request that includes model + tool spans and carries a handful of useful attributes (route, user tier, model, token counts if available).
Step 1: Decide your redaction rules first
Write this down before you ship any spans:
- what fields are allowed in span attributes?
- do you log prompts/completions at all, or only hashes/summaries?
- do you store tool inputs/outputs, or only timings and status codes?
If you skip this, you will either overshare (security risk) or go dark (no visibility).
Step 2: Instrument your LLM layer (manual or with an LLM wrapper)
Two reasonable approaches:
- Manual spans around your model calls and tool calls (boring, but explicit).
- An LLM-focused OpenTelemetry layer such as OpenLLMetry (Traceloop), which describes itself as open source tracing “built on top of OpenTelemetry,” exportable to your existing stack, and also documents what it does not collect in its own telemetry stream. Sources: What is OpenLLMetry?, OpenLLMetry telemetry docs.
Even if you use a wrapper, keep one rule: you own the trace boundary. Always make sure a user request starts the trace, so model/tool spans join the same context.
Step 3: Export via OTLP to a collector (not directly to the UI)
Sending telemetry straight to a UI/backend works for a demo, but it is a trap:
- you will want sampling
- you will want routing
- you will want different backends for dev vs prod
Put an OpenTelemetry Collector in the middle and keep your app exporter stable.
Start with OTLP over HTTP or gRPC and evolve from there. References: OTLP specification, Collector receiver components (including OTLP), OTLP exporter endpoint configuration.
Step 4: Pick a backend that matches your maturity
Three sane defaults:
- Phoenix if you want open-source-first tracing + evaluation workflows
- a managed observability platform if you already run one (and it speaks OTLP)
- a vendor LLM dashboard if the UX is worth it (prefer OTEL ingest)
The decision is less about “which UI is best” and more about:
- who needs access (engineers only? PMs? support?)
- data retention requirements
- privacy posture
- cost at your traffic level
Step 5: Add two constraints: sampling and budgets
Do not wait until you get your first surprising bill.
- Use sampling for high-volume endpoints.
- Set budgets/alerts around token spikes and latency regressions.
This pairs well with the thesis in How to Build a Practical AI Workflow Without Wasting Money: the best AI stack is the one that stays operational when usage gets real.
A concrete collector config (starter mental model)
The collector is just plumbing. The point is the shape:
receivers:
  otlp:
    protocols:
      http: {}
      grpc: {}

processors:
  batch: {}

exporters:
  otlphttp:
    endpoint: https://YOUR_BACKEND_OTLP_ENDPOINT

service:
  pipelines:
    traces:
      receivers: [otlp]
      processors: [batch]
      exporters: [otlphttp]
In practice you will add things like:
- attribute filtering/redaction processors
- sampling processors
- multiple exporters (dev vs prod, or traces vs logs)
But do not start there. Start with “does the trace show up end-to-end?”
The two traps that ruin tracing projects
Trap 1: You log everything, then you turn it off
If prompts/completions are sensitive (they usually are), treat them like production logs:
- minimize
- redact
- control access
- define retention
Tracing should stay enabled, not become a “special incident mode.”
Trap 2: You treat LLM tracing as separate from normal observability
LLM spans are not a separate universe.
They should join the same traces as:
- HTTP requests
- database calls
- queue jobs
- tool invocations
That is how you catch failures like “the model is fine, the tool timed out” or “the tool succeeded, but the agent loop doubled the cost.”
Where this is going (and why it matters)
As agents become more common, tracing stops being a nice-to-have and becomes the only sane way to operate them.
The ecosystem is converging on a useful compromise:
- OpenTelemetry + OTLP as the transport
- GenAI semantic conventions as the shared vocabulary (still evolving)
- backends that compete on UX and workflow, not on data captivity
If you build your tracing stack around that seam, you can adopt new tools without rewriting your app every time the “best dashboard” changes.
If you also want the connective layer for tool access and context (the other half of agent infrastructure), read: Why MCP Is Becoming the Default Standard for AI Tools in 2026.